Archive for the ‘Cost Savings’ Category
Product simplification is a battle for hearts and minds.
 October 14th, 2026
 With product simplification, it’s a battle for hearts and minds. You cannot simply ask the engineering community to design out half the parts because they don’t think it’s possible. The first step is to help them believe it’s possible.
 Posted in Cost Savings, Design Engineers, DFA, DFMA, Downstream Savings, New Thinking, Product Development |
  No Comments »
Product design is limiting the next level of profits.
September 2nd, 2026
 Process, process, process. Everything has been about process improvement over the last decade. And Lean has had a good run. But let’s face it. Its improvements have diminished, and it has largely hit a wall. And yet, we are doubling down on this tired old horse.
S-curves are real. Improvements are slow in the early stages, steep in mid-life, and they roll off as the system hits its asymptotic constraint. And that’s where Lean is now. It has hit its physical constraints defined by the product design. Yes, I said the product is the constraint. And without a radical change to the product, the next level of process improvement is blocked from coming to be. But it’s not as bad as it seems. In a sense, the bad news is the good news.
Over the last couple of decades, we forgot that the total cost is largely defined by the product design, not the manufacturing process. The design engineering community has been let off the hook and has not been tasked with designing the product with less material cost or designing it in a way that opens up space for the next generation of process simplification (Lean). The bad news is the product design has not changed and is blocking the next evolution of Lean. The good news is that because the product design hasn’t changed, it’s ripe for radical cost reduction. And the better news – changing the product itself can reduce material cost, and the material cost is at least 75% of the total cost. And, by definition, Lean, in its current and future embodiments, cannot reduce material cost. The only way to reduce material cost is to change the product design.
Lean has saved money, but because it cannot make changes to the product itself, it can only reduce labor cost. Here’s the math. If material cost is 75% of total cost, overhead is 5%, and labor cost is 20%, the domain of Lean’s savings has always been limited to about 20% of total cost. (There has never been a project that successfully reduced overhead, so that’s always off limits.) When the product itself becomes open to change, the potential for cost reduction is almost four times larger (20% to 70%). And that’s the good news. But the good news is also the bad news.
Yes, if the design can be changed, cost savings can be astronomical. But the bad news – there are no engineering leaders who know how to do it. And without engineering leaders advocating for, cajoling, prodding, and teaching product simplification, the engineering team cannot and will not pull it off.
The tools for product simplification exist, but the appreciation for their power has aged out with the previous generation of engineering leaders. And the knowledge of how to wield the tools has also aged out.
If you want to open up the next level of company profitability, you’ve got to simplify the product. Full stop. And if you want to achieve those 4X savings, you’ve got to hire an old pro who has done it before. Yes, I said old. (Maybe “experienced” is a better word?)
And before you get the bad idea to research the history of product simplification and the associated tools in the hopes of doing it on your own, don’t. More than anything, this journey is an emotional journey. You have to create the right conditions for the engineers to succeed, and that knowledge is not captured in the history books.
If you want to succeed, you’ll have to hire an old pro. This is The Way.
Image credit — Crosa
Map The Territory Before Improving It
August 26th, 2026
 I had the best teachers. They taught me to assess the situation as it is before trying to improve it. Early in my career, my leaders did not understand the importance of spending the time to define the current state. Hurry up and fix it! Why are you spending time analyzing the existing product? Why do you want to create a functional analysis of the product we want to obsolete? Why do you want to understand why customers purchased our legacy products?
By assessing the system/products as they are, I learned how to identify the elements to reuse, to improve, and to reinvent. This has been a great way to focus the resources on the most important elements and increase the intensity the allocated resources. When you don’t spend time on the 50% of the system that can be reused, you double the resource intensity over a complete redesign.
So, I ask you – how do you decide what can be reused, what must be improved, and what must be reinvented?
Regardless of the system’s size or scope of the project, assessing the current state is the right first step. For example, there is great interest in improving the business model. First question (that no one can answer) – What is our business model? There are tools to define business models visually to show the partners, competitors, customers, data flow, money flow, product flow. The tools show who does what to whom and how, who helps whom and how, and what’s missing. One of the tools I like is Wardley Maps. While Simon (Wardley) doesn’t talk much about mapping business models, I’ve misused his maps for business model mapping.
A rule for business models: If you can’t describe your business model visually on one page, you don’t know what your business model is and you can’t improve it.
And assessing the current state is effective at the leaf-level (the lowest level). Mapping the system functionally (functional decomposition with Axiomatic Design) and defining a problem rigorously (TRIZ), allows the team to place the problem in the context of the whole system AND to define the problem at the smallest level possible (think telescope to microscope).
A rule for problems – There’s nothing worse than solving the wrong problem, so you better be sure you’re solving the right one.
A long time ago, I led a project that took the time to assess the baseline product (existing product) for cost, part count, and part type. Using DFMA, ee knew where the parts were, and we designed them out and we knew where the cost was and we designed it out. It took a “long time” to do that work, but we radically improved the profitability of the new product (7X improvement in profit per square foot of the factory). We also did a full functional decomposition on the baseline product and learn that there was one subsystem that caused trouble with all the electronic systems and created problems for customers. We hardened the design against that subsystem’s devilish energy. And we created robustness tests where we tested the baseline product and demonstrated improved robustness on the new product. (We used TRIZ to solve the right problems.) Those efforts reduced warranty cost per unit by 4X.
Rigorously assessing the current state (products, processes, systems, business models) seems too slow and a big waste of time. It is my experience, though, that it’s faster and improves the outcomes of the new product development and improvement projects.
But don’t take my word for it. Give it a try. And if you need some help, let me know.
Image credit – Calsidyrose
Posted in Business Model, Cost Savings, DFMA, Downstream Savings, Fundementals, How To, Manufacturing Competitiveness, Product Development, Product Robustness, Seeing Things As They Are, TRIZ |  Tags: Design for Assembly, DFMA Culture, Manufacturing Competitveness, Part Count, Problem Definition, Product Development Engine |
No Comments »
Tags: Design for Assembly, DFMA Culture, Manufacturing Competitveness, Part Count, Problem Definition, Product Development Engine |
No Comments »
Designing your new product starts by understanding your existing one.
July 29th, 2026
 Everything starts from what’s been done before. Designing a new product starts with assessing the subassemblies of your existing product. Here’s how the assessments go for the subassemblies.
First, make two Pareto charts: cost by subassembly and part count by subassembly. Prioritize the subassemblies on the left of both charts.
If the functionality is sufficient and the cost is right, reuse it as-is. This allows you to spend your time and energy elsewhere.
If the cost is right but the functionality needs to be adjusted, adjust it and move on. The technical risk is low, and the cost will still be right. Spend your energy where the problems are.
If functionality is good and the cost is high, simplify the product using part count reduction. Create a bench test to verify functionality and robustness are better than the old one.
If the functionality is insufficient and the cost is too high, spend your energy here. Create a bench test to quantify the performance of the existing subassembly. Turn up the dials to increase the stress on the subassembly until it breaks. Fix the part that breaks. Repeat until you run out of time. Create two Pareto charts for the subassembly: cost by part and part count by part type (main part, fastener, connector, protection, label). Design out the highest cost parts and redesign the highest cost parts that remain. Design out fasteners, connectors, protection parts, and labels.
Create a functional test for the product as a whole (think miles per gallon for a new car) and test the old one until it breaks. Build the new product with the new subassemblies and test it until it breaks. The performance must be better, and it must perform under stress longer than the baseline product. Break the new product, fix the weakest link, and retest. Do this until you run out of time and launch it.
This is The Way.
Image credit — George Redgrave
Posted in Clarity, Cost Savings, DFA, DFMA, Floor Space, Fundementals, How To, Manufacturing Competitiveness, Part Count Reduction, Product Development, Product Robustness, Risk, Seeing Things As They Are, Seven Wastes, Top Line Growth |
Tags: Design for Assembly, DFA, DFMA Culture, Downstream Savings, Engage Design; Product Design; Cost Savings, Manufacturing Competitveness, Product Design, Understanding Physics |
No Comments »
How I Develop Engineering Leaders
May 14th, 2025

For the past twenty-five years, I’ve actively developed engineering leaders. Here is the curriculum in the form of How Tos:
How to build trust. This is the first thing. Always. Done right, the trust-based informal networks are stronger than the formal organization chart. Done right, the informal networks can protect the company from bad decisions. Done right, the right information flows among the right engineers at the right time so the right work happens in the right way.
How to decide what to do next. This is a broad one. We start with a series of questions: What are we doing now? What’s the problem? How do you know? What should we do more of? What should we do less of? What resources are available? When must we be done?
How to map the current state. We don’t define the idealized future state or the North Star, we start with what’s happening now. We make one-page maps of the territory. We use drawings, flow charts, boxes/arrows, and the fewest words. And we take no action before there’s agreement on how things are. The value of GPS isn’t to define your destination, it’s to establish your location. That’s why we map the current state.
How to build momentum. It’s easy to jump onto a moving steam train, but a stationary one is difficult to get moving. We define the active projects and ask – How might we hitch our wagon to a fast-moving train?
How to start something new. We start small and make a thought-provoking demo. The prototype forces us to think through all the elements, makes things real, and helps others understand the concept. If that doesn’t work, we start smaller.
How to define problems so we can solve them easily. We define problems with blocks and arrows, and limit ourselves to one page. The problem is defined as a region of contact between two things, and we identify it with the color red. That helps us know where the problem is and when it occurs. If there are two problems on a page, we break it up into two pages with one problem. Then we decide to solve the problem before, during, or after it occurs.
How to design products that work better and cost less. We create Pareto charts of the cost of the existing product (cost by subassembly and cost by part) and set a cost reduction goal. We create Pareto charts of the part count of the existing product (part count by subassembly and part count by individual part number) and define a goal for part count reduction. We define test protocols that capture the functionality customers care about. We test the existing product and set performance improvement goals for the new one. We test the new product using the same protocols and show the data in a simple A-B format. We present all this data at formal design reviews.
How to define technology projects. We define how the customer does their work. We then define the evolutionary history of our products and services, and project that history forward. For lines of goodness with trajectories that predict improvement, we run projects to improve them. For lines of goodness with stalled trajectories, we run projects to establish new technologies and jump to the next S-curve. We assess our offerings for completeness and create technologies to fill the gap.
How to file the right patents. We ask these questions: How quickly will the customer notice the new functionality or benefit? Once recognized, will they care? Will the patent protect high-volume / high-margin consumables? There are more questions, but these are the ones we start with. And the patent team is an integral part of the technology reviews and product development process.
How to do the learning. We start with the leader’s existing goals and deliverables and identify the necessary How Tos to get their work done. There are no special projects or extra work.
If you’re interested in learning more about the curriculum, send me an email at mike@shipulski.com.
Image credit — Paul VanDerWerf
Posted in A/B Data, Allocating Cost, Bottom Line Growth, Clarity, Cost Savings, Design Engineers, DFA, DFMA, Engineering Leaders, Fundementals, How To, Innovation, Maps, One Page Thinking, Part Count Reduction, Problems, Product Development, Product Robustness, Technology, The Future, Trust |
Tags: Cost Reduction, Cost Savings, Design for Assembly, Engage Design; Product Design; Cost Savings, Fear, Part Count, Problem Definition, Problems, Product Design, Product Development Engine, Trust-based approach, Understanding Physics, Words |
No Comments »
How To Reduce the Tariff Signature of Your Supply Chain
April 9th, 2025
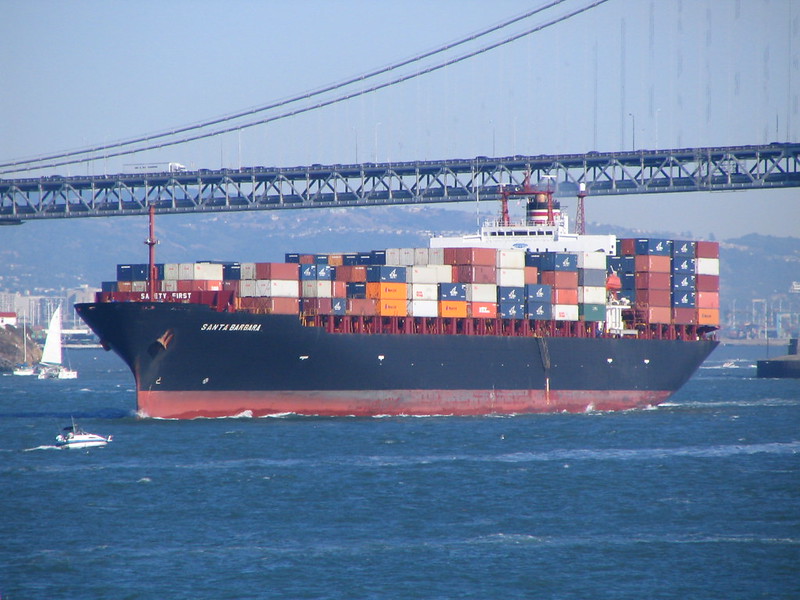 Supply chains have taken it on the chin, first from COVID-19 and now from tariffs (or the threat of them). For the second time in several years, we have objective evidence there is more to a supply chain than implementing the lowest-cost way to meet predictable demand. Tariffs have highlighted the cost of an inflexible supply chain because we can quantify the savings from moving parts to countries with lower tariffs.
With tariffs, Lean’s mantra of “make it where you sell it” has sharper teeth.
At the most fundamental level, supply chains are governed by the parts. Big parts, big factories; small parts, small machines; high part volume, high volume processes; low part volume, low volume processes; specialized coatings on the parts, specialized suppliers; parts with proprietary materials, sole source supplier. The supply chain is defined by its parts. And when you try to move the manufacture of parts from one country to another, these part-based constraints are the very thing that creates supply chain inflexibility. Said another way, if you want to improve a supply chain’s flexibility, you’ve got to start with the parts. If you want to reduce the tariffs of your supply chain, start with the parts.
All the parts in the supply chain are important but with tariffs, some parts are more important than others. You can make significant improvements in your supply chain’s tariff signature if you know the handful of parts that will deliver the largest tariff reduction. For each part within your supply chain calculate
(material cost x volume x tariff percentage)
and sort the product from largest to smallest. For the top ten parts assess the part-specific constraints that governed the original decision of the supplier and country. For each part identify a country with lower tariffs and pair it with the part-specific constraints. You now have a list of the top ten opportunities to reduce the tariff signature, what must change in the design to move to a lower tariff location, and the entitlement savings. The DFM-based tariff savings for each part is
(part cost x volume x difference in tariff percentage).
Take your top ten list to the product owner and show them the potential savings and ask to meet with the design community so you can explain how each part must change so it can move to a lower tariff country. And tell them how much the company will save if those constraints are overcome. This is like classic Design for Manufacturing (DFM) where the part is changed to reduce the cost to make the part, but, instead, the part is changed to reduce the cost of tariffs.
You now have a playbook for the top ten parts, the estimated tariff savings, and the work required to realize those savings. You don’t have to implement the playbook, but you can. And you can repeat the process for the next ten most important parts (11-20). Now you have a playbook for twenty parts and the estimated savings. You can continue the process as needed and step through the list ten parts at a time.
The process I describe is a good way to reduce the cost of tariffs. But to make a dent in the universe, there’s a much better way. It’s called Design For Assembly, or DFA, which is all about product simplification through part elimination. 35% reductions in the number of parts are typical. With DFA, high-tariff parts aren’t changed, they’re eliminated. But where classic DFA prioritizes eliminating the highest-cost parts, tariff-based DFA prioritizes eliminating parts with the highest tariff costs. The calculations to prioritize DFA-based tariff reduction are similar to those for DFM, but the savings are far more severe – the entire tariff and the part cost are saved. The DFA savings are
(part cost x volume x tariff percentage) + (part cost x volume)
Run the calculation for the parts in your supply chain and sort the results from largest to smallest. Take the list of the top ten to the design community and show them how much they can save if they eliminate the parts. Tell them they’ll be the Heros of the Company if they pull it off. Tell them you help them get the tools and training they’ll need. Repeat for the second group of the ten most important parts (11-20).
DFM and DFA are wildly profitable and with the added savings of tariffs, the savings are beyond wild. If there was ever a time to do DFM and DFA, it’s is now.
Image credit — Derell Licht
Posted in Cost Savings, DFA, DFMA, Fundementals, How To, Lean, Manufacturing Competitiveness, New Normal, Seven Wastes |
Tags: Design for Assembly, DFA, DFMA Culture, Engineering Capability, Product Design |
No Comments »
If you want to make a difference, change the design.
October 9th, 2024
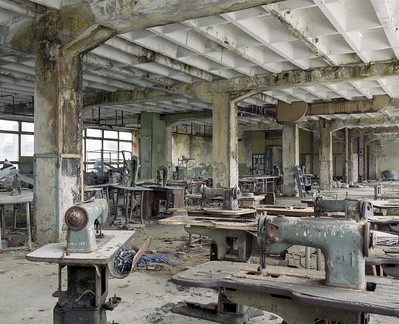 Why do factories have 50-ton cranes? Because the parts are heavy and the fully assembled product is heavier. Why is the Boeing assembly facility so large? Because 747s are large. Why does a refrigerator plant have a huge room to accumulate a massive number of refrigerators that fail final test? Because refrigerators are big, because volumes are large, and a high fraction fail final test. Why do factories look as they do? Because the design demands it.
Why are parts machined? Because the materials, geometries, tolerances, volumes, and cost requirements demand it. Why are parts injection molded? Because the materials, geometries, tolerances, volumes, and cost requirements demand it. Why are parts 3D printed? For prototypes, because the design can tolerate the class of materials that can be printed and can withstand the stresses and temperature of the application for a short time, the geometries are printable, and the parts are needed quickly. For production parts, it’s because the functionality cannot be achieved with a lower-cost process, the geometries cannot be machined or molded, and the customer is willing to pay for the high cost of 3D printing. Why are parts made as they are? Because the design demands it.
Why are parts joined with fasteners? It’s because the engineering drawings define the holes in the parts where the fasteners will reside and the fasteners are called out on the Bills Of Material (BOM). The parts cannot be welded or glued because they’re designed to use fasteners. And the parts cannot be consolidated because they’re designed as separate parts. Why are parts held together with fasteners? Because the design demands it.
If you want to reduce the cost of the factory, change the design so it does not demand the use of 50-ton cranes. If you want to get by with a smaller factory, change the design so it can be built in a smaller factory. If you want to eliminate the need for a large space to store refrigerators that fail final test, change the design so they pass. Yes, these changes are significant. But so are the savings. Yes, a smaller airplane carries fewer people, but it can also better serve a different set of customer needs. And, yes, to radically reduce the weight of a product will require new materials and a new design approach. If you want to reduce the cost of your factory, change the design.
If you want to reduce the cost of the machined parts, change the geometry to reduce cycle time and change to a lower-cost material. Or, change the design to enable near-net forging with some finish machining. If you want to reduce the cost of the injection molded parts, change the geometry to reduce cycle time and change the design to use a lower-cost material. If you want to reduce the cost of the 3D printed parts, change the design to reduce the material content and change the design and use lower-cost material. (But I think it’s better to improve function to support a higher price.) If you want to reduce the cost of your parts, change the design to make possible the use of lower-cost processes and materials.
If you want to reduce the material cost of your product, change the design to eliminate parts with Design for Assembly (DFA). What is the cost of a part that is designed out of the product? Zero. Is it possible to wrongly assemble a part that was designed out? No. Can a part that’s designed out be lost or arrive late? No and no. What’s the inventory cost of a part that’s been designed out? Zero. If you design out the parts is your supply chain more complicated? No, it’s simpler. And for those parts that remain use Design for Manufacturing (DFM) to work with your suppliers to reduce the cost of making the parts and preserve your suppliers’ profit margins.
If you want to sell more, change the design so it works better and solves more problems for your customers. And if you want to make more money, change the design so it costs less to make.
Resurrecting Manufacturing Through Product Simplification
October 2nd, 2024
Product simplification can radically improve profits and radically improve product robustness. Here’s a graph of profit per square foot ($/ft^2) which improved by a factor of seven and warranty cost per unit ($/unit), a measure of product robustness), which improved by a factor of four. The improvements are measured against the baseline data of the legacy product which was replaced by the simplified product. Design for Assembly (DFA) was used to simplify the product and Robust Design methods were used to reduce warranty cost per unit.
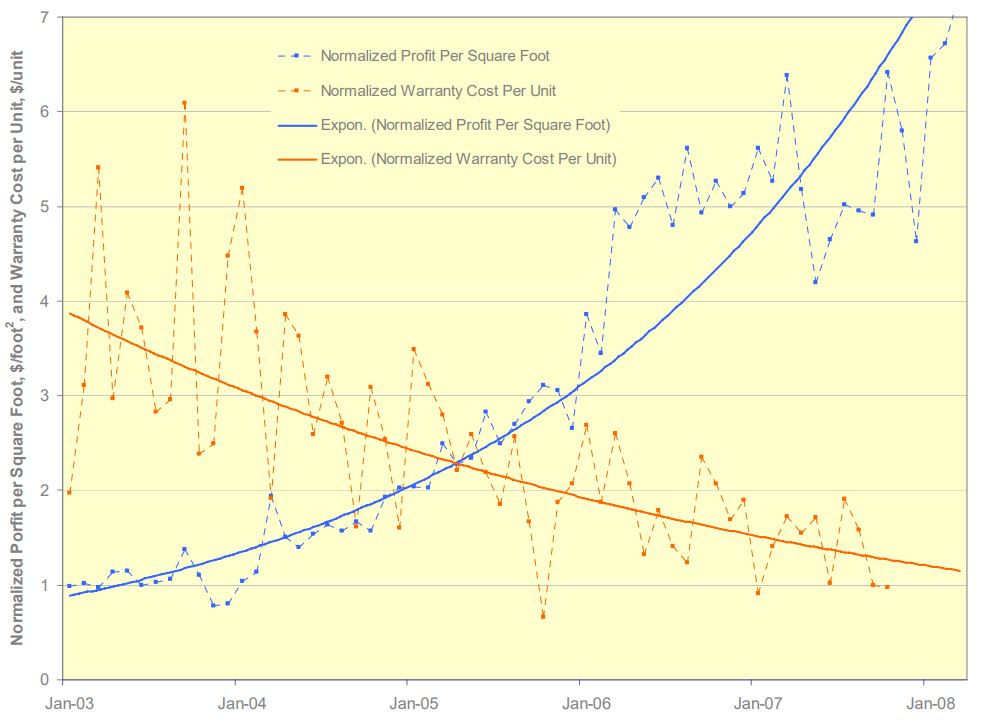
I will go on record that everyone will notice when profit per square foot increases by a factor of seven.
And I will also go on record that no one will believe you when you predict product simplification will radically improve profit per square foot.
And I will go on record that when warranty cost per unit is radically reduced, customers will notice. Simply put, the product doesn’t break and your customers love it.
But here’s the rub. The graph shows data over five years, which is a long time. And if the product development takes two years, that makes seven long years. And in today’s world, seven years is at least four too many. But take another look at the graph. Profit per square foot doubled in the first two years after launch. Two years isn’t too long to double profit per square foot. I don’t know of a faster way, More strongly, I don’t know of another way to get it done, regardless of the timeline.
I think your company would love to double the profit per square foot of its assembly area. And I’ve shown you the data that proves it’s possible. So, what’s in the way of giving it a try?
For the details about the work, here’s a link – Systematic DFMA Deployment, It Could Resurrect US Manufacturing.
Posted in Assembly Time Reduction, Bottom Line Growth, Cost Savings, Design Engineers, DFA, DFMA, Downstream Savings, Floor Space, Fundementals, How To, Lean, Manufacturing Competitiveness, Part Count Reduction, Product Development, Product Robustness, Robust Economy, Seven Wastes, Top Line Growth |
No Comments »
Too Much of a Good Thing
October 11th, 2023
 Product cost reduction is a good thing.
Too much focus on product cost reduction prevents product enhancements, blocks new customer value propositions, and stifles top-line growth.
Voice of the Customer (VOC) activities are good.
Because customers don’t know what’s possible, too much focus on VOC silences the Voice of the Technology (VOT), blocks new technologies, and prevents novel value propositions. Just because customers aren’t asking for it doesn’t mean they won’t love it when you offer it to them.
Standard work is highly effective and highly productive.
When your whole company is focused on standard work, novelty is squelched, new ideas are scuttled, and new customer value never sees the light of day.
Best practices are highly effective and highly productive.
When your whole company defaults to best practices, novel projects are deselected, risk is radically reduced (which is super risky), people are afraid to try new things and use their judgment, new products are just like the old ones (no sizzle), and top-line growth is gifted to your competitors.
Consensus-based decision-making reduces bad decisions.
In domains of high uncertainty, consensus-based decision-making reduces projects to the lowest common denominator, outlaws the use of judgment and intuition, slows things to a crawl, and makes your most creative people leave the company.
Contrary to Mae West’s maxim, too much of a good thing isn’t always wonderful.
Image credit — Krassy Can Do It
Posted in Cost Savings, Innovation, Risk, Top Line Growth |
Tags: Creativity, Fear, Lessons Learned |
No Comments »
You are defined by the problems you solve.
April 12th, 2023
 You can solve problems that reduce the material costs of your products.
You can solve problems that reduce the number of people that work at your company.
You can solve problems that save your company money.
You can solve problems that help your customers make progress.
You can solve problems that make it easier for your customers to buy from you.
You can solve too many small problems and too few big problems.
You can solve problems that ripple profits through your whole organization.
You can solve local problems.
You can solve problems that obsolete your best products.
You can solve problems that extend and defend your existing products.
You can solve problems that spawn new businesses.
You can solve the wrong problems.
You can solve problems before their time or after it is too late.
You can solve problems that change your company or block it from change.
You are defined by the problems you solve. So, which type of problems do you solve and how do you feel about that?
Image credit – Maureen Barlin
Radical Cost Reduction and Reinvented Supply Chains
October 26th, 2022
 As geopolitical pressures rise, some countries that supply the parts that make up your products may become nonviable. What if there was a way to reinvent the supply chain and move it to more stable regions? And what if there was a way to guard against the use of child labor in the parts that make up your product? And what if there was a way to shorten your supply chain so it could respond faster? And what if there was a way to eliminate environmentally irresponsible materials from your supply chain?
Our supply chains source parts from countries that are less than stable because the cost of the parts made in those countries is low. And child labor can creep into our supply chains because the cost of the parts made with child labor is low. And our supply chains are long because the countries that make parts with the lowest costs are far away. And our supply chains use environmentally irresponsible materials because those materials reduce the cost of the parts.
The thing with the supply chains is that the parts themselves govern the manufacturing processes and materials that can be used, they dictate the factories that can be used and they define the cost. Moving the same old parts to other regions of the world will do little more than increase the price of the parts. If we want to radically reduce cost and reinvent the supply chain, we’ve got to reinvent the parts.
There are methods that can achieve radical cost reduction and reinvent the supply chain, but they are little known. The heart of one such method is a functional model that fully describes all functional elements of the system and how they interact. After the model is complete, there is a straightforward, understandable, agreed-upon definition of how the product functions which the team uses to focus the go-forward design work. And to help them further, the method provides guidelines and suggestions to prioritize the work.
I think radical cost reduction and more robust supply chains are essential to a company’s future. And I am confident in the ability of the methods to deliver solid results. But what I don’t know is: Is the need for radical cost reduction strong enough to cause companies to adopt these methods?
“Zen” by g0upil is licensed under CC BY-SA 2.0.
 Mike Shipulski