Archive for the ‘Manufacturing Competitiveness’ Category
Product design is limiting the next level of profits.
 September 2nd, 2026
 Process, process, process. Everything has been about process improvement over the last decade. And Lean has had a good run. But let’s face it. Its improvements have diminished, and it has largely hit a wall. And yet, we are doubling down on this tired old horse.
S-curves are real. Improvements are slow in the early stages, steep in mid-life, and they roll off as the system hits its asymptotic constraint. And that’s where Lean is now. It has hit its physical constraints defined by the product design. Yes, I said the product is the constraint. And without a radical change to the product, the next level of process improvement is blocked from coming to be. But it’s not as bad as it seems. In a sense, the bad news is the good news.
Over the last couple of decades, we forgot that the total cost is largely defined by the product design, not the manufacturing process. The design engineering community has been let off the hook and has not been tasked with designing the product with less material cost or designing it in a way that opens up space for the next generation of process simplification (Lean). The bad news is the product design has not changed and is blocking the next evolution of Lean. The good news is that because the product design hasn’t changed, it’s ripe for radical cost reduction. And the better news – changing the product itself can reduce material cost, and the material cost is at least 75% of the total cost. And, by definition, Lean, in its current and future embodiments, cannot reduce material cost. The only way to reduce material cost is to change the product design.
Lean has saved money, but because it cannot make changes to the product itself, it can only reduce labor cost. Here’s the math. If material cost is 75% of total cost, overhead is 5%, and labor cost is 20%, the domain of Lean’s savings has always been limited to about 20% of total cost. (There has never been a project that successfully reduced overhead, so that’s always off limits.) When the product itself becomes open to change, the potential for cost reduction is almost four times larger (20% to 70%). And that’s the good news. But the good news is also the bad news.
Yes, if the design can be changed, cost savings can be astronomical. But the bad news – there are no engineering leaders who know how to do it. And without engineering leaders advocating for, cajoling, prodding, and teaching product simplification, the engineering team cannot and will not pull it off.
The tools for product simplification exist, but the appreciation for their power has aged out with the previous generation of engineering leaders. And the knowledge of how to wield the tools has also aged out.
If you want to open up the next level of company profitability, you’ve got to simplify the product. Full stop. And if you want to achieve those 4X savings, you’ve got to hire an old pro who has done it before. Yes, I said old. (Maybe “experienced” is a better word?)
And before you get the bad idea to research the history of product simplification and the associated tools in the hopes of doing it on your own, don’t. More than anything, this journey is an emotional journey. You have to create the right conditions for the engineers to succeed, and that knowledge is not captured in the history books.
If you want to succeed, you’ll have to hire an old pro. This is The Way.
Image credit — Crosa
Map The Territory Before Improving It
August 26th, 2026
 I had the best teachers. They taught me to assess the situation as it is before trying to improve it. Early in my career, my leaders did not understand the importance of spending the time to define the current state. Hurry up and fix it! Why are you spending time analyzing the existing product? Why do you want to create a functional analysis of the product we want to obsolete? Why do you want to understand why customers purchased our legacy products?
By assessing the system/products as they are, I learned how to identify the elements to reuse, to improve, and to reinvent. This has been a great way to focus the resources on the most important elements and increase the intensity the allocated resources. When you don’t spend time on the 50% of the system that can be reused, you double the resource intensity over a complete redesign.
So, I ask you – how do you decide what can be reused, what must be improved, and what must be reinvented?
Regardless of the system’s size or scope of the project, assessing the current state is the right first step. For example, there is great interest in improving the business model. First question (that no one can answer) – What is our business model? There are tools to define business models visually to show the partners, competitors, customers, data flow, money flow, product flow. The tools show who does what to whom and how, who helps whom and how, and what’s missing. One of the tools I like is Wardley Maps. While Simon (Wardley) doesn’t talk much about mapping business models, I’ve misused his maps for business model mapping.
A rule for business models: If you can’t describe your business model visually on one page, you don’t know what your business model is and you can’t improve it.
And assessing the current state is effective at the leaf-level (the lowest level). Mapping the system functionally (functional decomposition with Axiomatic Design) and defining a problem rigorously (TRIZ), allows the team to place the problem in the context of the whole system AND to define the problem at the smallest level possible (think telescope to microscope).
A rule for problems – There’s nothing worse than solving the wrong problem, so you better be sure you’re solving the right one.
A long time ago, I led a project that took the time to assess the baseline product (existing product) for cost, part count, and part type. Using DFMA, ee knew where the parts were, and we designed them out and we knew where the cost was and we designed it out. It took a “long time” to do that work, but we radically improved the profitability of the new product (7X improvement in profit per square foot of the factory). We also did a full functional decomposition on the baseline product and learn that there was one subsystem that caused trouble with all the electronic systems and created problems for customers. We hardened the design against that subsystem’s devilish energy. And we created robustness tests where we tested the baseline product and demonstrated improved robustness on the new product. (We used TRIZ to solve the right problems.) Those efforts reduced warranty cost per unit by 4X.
Rigorously assessing the current state (products, processes, systems, business models) seems too slow and a big waste of time. It is my experience, though, that it’s faster and improves the outcomes of the new product development and improvement projects.
But don’t take my word for it. Give it a try. And if you need some help, let me know.
Image credit – Calsidyrose
 Posted in Business Model, Cost Savings, DFMA, Downstream Savings, Fundementals, How To, Manufacturing Competitiveness, Product Development, Product Robustness, Seeing Things As They Are, TRIZ |
  Tags: Design for Assembly, DFMA Culture, Manufacturing Competitveness, Part Count, Problem Definition, Product Development Engine |
  No Comments »
Designing your new product starts by understanding your existing one.
July 29th, 2026
 Everything starts from what’s been done before. Designing a new product starts with assessing the subassemblies of your existing product. Here’s how the assessments go for the subassemblies.
First, make two Pareto charts: cost by subassembly and part count by subassembly. Prioritize the subassemblies on the left of both charts.
If the functionality is sufficient and the cost is right, reuse it as-is. This allows you to spend your time and energy elsewhere.
If the cost is right but the functionality needs to be adjusted, adjust it and move on. The technical risk is low, and the cost will still be right. Spend your energy where the problems are.
If functionality is good and the cost is high, simplify the product using part count reduction. Create a bench test to verify functionality and robustness are better than the old one.
If the functionality is insufficient and the cost is too high, spend your energy here. Create a bench test to quantify the performance of the existing subassembly. Turn up the dials to increase the stress on the subassembly until it breaks. Fix the part that breaks. Repeat until you run out of time. Create two Pareto charts for the subassembly: cost by part and part count by part type (main part, fastener, connector, protection, label). Design out the highest cost parts and redesign the highest cost parts that remain. Design out fasteners, connectors, protection parts, and labels.
Create a functional test for the product as a whole (think miles per gallon for a new car) and test the old one until it breaks. Build the new product with the new subassemblies and test it until it breaks. The performance must be better, and it must perform under stress longer than the baseline product. Break the new product, fix the weakest link, and retest. Do this until you run out of time and launch it.
This is The Way.
Image credit — George Redgrave
Posted in Clarity, Cost Savings, DFA, DFMA, Floor Space, Fundementals, How To, Manufacturing Competitiveness, Part Count Reduction, Product Development, Product Robustness, Risk, Seeing Things As They Are, Seven Wastes, Top Line Growth |
Tags: Design for Assembly, DFA, DFMA Culture, Downstream Savings, Engage Design; Product Design; Cost Savings, Manufacturing Competitveness, Product Design, Understanding Physics |
No Comments »
Double-Barreled Profitability
May 6th, 2026
 The need to grow revenue and profit is ever-present. And as the pace of change accelerates and competitors elevate their game, it’s getting more difficult.
Growth must be built on top of your best work. To grow, you must develop new products and services that make your customers swap out the old offering they just bought from you for the new one you just launched. And you must develop the new product with the team that developed the old one. This is difficult. You need to create the conditions for the team to see their best work as crap and prevent them from seeing themselves as crap.
For customers to replace an existing product with a new one, the new product must help customers make more progress than the old one. In a word, the new one must be better, or customers won’t buy it. And if they don’t buy the new one, there can be no growth. But here’s the difficult part – when the team built the old one, they designed in as much goodness as possible, yet your task is to help the team design a better one. Hey Team, congratulations on the wonderful success of the existing product. You did new work in new ways; you stretched; you hustled; you sprinted. Now, you must outdo yourselves, even though you just did that. This is quite the balancing act for the engineering leader.
Growth comes when the team designs a product that works better than the one they designed last time.
Designing a new product that works better is only half of the profitability recipe. It must also cost less. Yes, it must work better AND cost less. Yes, I said AND. Most teams don’t believe they can design a new product that costs less, and they think you’re crazy when you tell them the new one must work better and cost less. But this type of double-barreled profitability improvement is possible and proven. But only if the engineering leader believes it. And most don’t.
Growth is realized when the team designs a new product that works better AND costs less.
You can radically improve profitability with this double-barreled approach. I’ve used it to more than double the profit per square foot of the assembly area. And that makes the CFO smile and gets you lunch with the CEO. It’s good for profitability and better for your career.
Radical growth comes from obsoleting your best work, but only if you think it’s possible.
Image credit — Don Miller – double rainbow
Developing Engineering Leaders Is Done Differently
April 22nd, 2026
 Go faster. Do it better. Do more with less. Meet the growth objective. All good ideas, but how? In two words: Engineering Leadership.
Going forward, competition will be fiercer. Engineering organizations will be asked to do better engineering work, even though they did that on the previous project. And to do that, engineering leaders will have to up their game. They will have to improve the engineers’ performance on the job and their own performance.
I think engineering leadership development is a singular challenge for companies that want to thrive and grow. And for mature companies, I think it will become more difficult as these companies reduce headcount. The burden on engineering leaders will grow as there are fewer leaders, more projects to complete, more work to elevate, and each leader will have more direct reports. It’s already difficult for engineering leaders to make time to grow engineers and to do it without guidance and support, but I think it will become more difficult.
And developing engineering leaders is difficult for younger companies that want to grow. These companies have engineering leaders with less experience and are new to the company and the industry. The organizational design is still forming and fluid, the work processes are still under development, and there are far more projects to deliver. Engineering leaders must create the organizational structure, identify engineering talent to develop, fill organizational holes, and increase design productivity to meet the company’s growth targets. These are big challenges for new-to-role engineering leaders who must get it done without mentorship and guidance.
Often, companies try to use standard leadership development programs to grow engineering leaders, but in my experience, these generic leadership programs don’t cut it. Every aspect of engineering leadership work has a technical bias that shapes the work, the processes, and the approaches. Generic leadership development programs are not built on a technical backplane and don’t provide the specialized guidance and support for the work.
Engineering leadership development is different.
Engineering leadership development comes with unique challenges. And to further complicate things, those challenges differ between mature companies and younger companies.
Your products and technologies are different.
Your processes are different.
Your business models are different.
And your engineering leadership development program should be different.
Image credit — Bennilover
Would you rather have too many projects or too many resources?
February 11th, 2026
 When you have more projects than people, you have far more activity but far less progress.
Pro Tip: Activity doesn’t pay the bills. Progress does.
Would you rather make lightning progress on two projects or tortoise progress on four? I prefer lightning.
But isn’t four projects better than two? It is, if you get compensated for the number of active projects. But it’s not, if you get compensated for finishing projects.
Pro tip: There’s no partial credit for a project that’s less than 100% done.
But how to protect your resources from four projects when you have the resources to deliver on two? This is not a complicated answer: block the extra project from entering the pipeline until you finish one.
Pro Tip: Finish one before you start one, not the other way around.
But what about the efficiency that comes from shared resources that can be spread over four projects? Don Reintertsen would say “Shared resources create waiting and waiting is the enemy.” I agree with Don, but I think his language is too reserved. I say “If you’re focused on the efficiency that comes from shared resources, you don’t know what you’re doing.”
Pro Tip: Waiting kills progress. Don’t do it.
Here’s a process to consider.
- Define the resources you have on hand to work on projects.
- Choose the most important project and fully staff the project. If the project is fully staffed, start the project.
- Define the remaining unallocated resources.
- Choose the next most important project and fully staff the project. If the project is fully staffed, start the project. If the project is not fully staffed, don’t start a project until you finish one, or you can hire the incremental resources to fully staff a project.
- Repeat.
Image credit – KIUKO (Elephant Tortoise)
Projects generate progress.
January 7th, 2026
 Companies make progress through projects.
Projects have objectives that are defined by the company’s growth or improvement objectives.
Projects have quantifiable goals that are, hopefully, time-bound.
Projects require resources, and those resources limit the number of projects that are completed.
Projects are run with the resources allocated, not with the resources we want to allocate.
Projects have timelines that are governed by the work content, novelty, and resources.
Project timelines cannot violate the governing constraints of work content, novelty, and resources.
Projects have project managers, or they’re not projects.
Projects can be accelerated by eliminating waiting. To find the waiting, look for the work queued up in front of the bottleneck resources. Those resources are usually resources that support multiple projects (shared resources). When it comes to waiting, shared resources are almost always the culprit.
Projects have a critical path. A one-day delay (waiting) on the critical path delays project completion by a day. That’s how you know it’s the critical path.
If you don’t know the project’s critical path, you don’t know much.
When it comes to projects, effectiveness is far more important than efficiency, yet we fixate on efficiency. Would you rather run the wrong project efficiently (ineffective) or run the right project inefficiently (effective)?
Regardless of the business you’re in, it’s all about the projects.
Image credit — State Library of South Australia
Overcoming Your Success
December 3rd, 2025
 Success locks in current practice.
May you have the blessing of declining revenues to see what must change.
Year-on-year growth hides inefficiencies.
May you have one bad year to help you see those inefficiencies.
Past success blinds us to the onset of decline.
May you have brave heretics to sound the alarm early in the decline.
A strong track record of growth prevents new ideas from seeing the light of day.
May you allocate revenue from that growth to bring the next-generation offering to life.
High market share creates intellectual inertia and stagnation.
May you have the luxury of strong competitors that get stronger every year.
A history of unassailable technical advantage breeds competence-induced failure.
May you have the courage to obsolete your best work.
A strong focus on process, combined with remarkable success, extends standard work beyond its useful life.
May you recognize that commercial conditions have changed, and it’s time to dismantle the very thing that generated your success.
Image credit — Thomas_H_foto
Posted in Level 5 Courage, Manufacturing Competitiveness, The Future |
Tags: Competitiveness, Lessons Learned, Success |
No Comments »
996 or Bust
October 1st, 2025
 996 is all the rage. You work 9 am to 9 pm, 6 days a week. Startups are doing it. Might non-startups start doing it?
Productivity is important and competition is severe. And I’m all for working hard, but I don’t think the 996 schedule is the most effective way to achieve productivity goals, at least not for all jobs.
My decision-making capabilities diminish when I am tired, and I would be tired if I worked a 996 schedule. My interpersonal and organizational effectiveness would suffer if I worked 996. My planning skills would degrade if I worked 996. My family life would suffer if I worked 996. And my physical and mental health would degrade..
In my work, I make many decisions, I create conditions for teams and organizations to do new work, and I contemplate the future and figure out what to do next. Maybe I should be able to do this work well with a 996 schedule. But I know myself, and I know I would be far less effective working 996. Maybe my work is uniquely unfit for 996? Maybe I am uniquely unfit for 996?
Some questions for you:
- How many hours can you concentrate in one day?
- How about the second day?
- If you worked a 996 schedule, would you get more done?
- How many weeks could you work 996 before the wheels fall off?
The startup pace is rapid. Progress must be made before the money runs out. At these early stages, when a company’s existence depends on hitting the super agressive timelines, I think 996 is especially attractive to startup companies The potential financial upside is large which may make for a fair trade – more hours for the chance of outsized compensation.
But what if an established company sets extremely tight timelines and offers remarkable compensation if those timelines are met? Does 996 become viable? What if an established company sets startup-like timelines but without added compensation? Would 996 be viable in that case?
Some countries and regions work a 996 schedule as a matter of course – no limited to startups and (likely) no special compensation. And it seems to work for them, at least from the outside. And 996 may be an important supporting element of their impressively low costs, high quality, and speed.
If those countries amd regions can sustain their 996 culture, and I think they will, it will create pressure on other countries to adopt a similar approach to avoid falling further behind.
I’m unsure what broad adoption of 996 would mean for the world.
Image credit — Evan
How To Reduce the Tariff Signature of Your Supply Chain
April 9th, 2025
 Supply chains have taken it on the chin, first from COVID-19 and now from tariffs (or the threat of them). For the second time in several years, we have objective evidence there is more to a supply chain than implementing the lowest-cost way to meet predictable demand. Tariffs have highlighted the cost of an inflexible supply chain because we can quantify the savings from moving parts to countries with lower tariffs.
With tariffs, Lean’s mantra of “make it where you sell it” has sharper teeth.
At the most fundamental level, supply chains are governed by the parts. Big parts, big factories; small parts, small machines; high part volume, high volume processes; low part volume, low volume processes; specialized coatings on the parts, specialized suppliers; parts with proprietary materials, sole source supplier. The supply chain is defined by its parts. And when you try to move the manufacture of parts from one country to another, these part-based constraints are the very thing that creates supply chain inflexibility. Said another way, if you want to improve a supply chain’s flexibility, you’ve got to start with the parts. If you want to reduce the tariffs of your supply chain, start with the parts.
All the parts in the supply chain are important but with tariffs, some parts are more important than others. You can make significant improvements in your supply chain’s tariff signature if you know the handful of parts that will deliver the largest tariff reduction. For each part within your supply chain calculate
(material cost x volume x tariff percentage)
and sort the product from largest to smallest. For the top ten parts assess the part-specific constraints that governed the original decision of the supplier and country. For each part identify a country with lower tariffs and pair it with the part-specific constraints. You now have a list of the top ten opportunities to reduce the tariff signature, what must change in the design to move to a lower tariff location, and the entitlement savings. The DFM-based tariff savings for each part is
(part cost x volume x difference in tariff percentage).
Take your top ten list to the product owner and show them the potential savings and ask to meet with the design community so you can explain how each part must change so it can move to a lower tariff country. And tell them how much the company will save if those constraints are overcome. This is like classic Design for Manufacturing (DFM) where the part is changed to reduce the cost to make the part, but, instead, the part is changed to reduce the cost of tariffs.
You now have a playbook for the top ten parts, the estimated tariff savings, and the work required to realize those savings. You don’t have to implement the playbook, but you can. And you can repeat the process for the next ten most important parts (11-20). Now you have a playbook for twenty parts and the estimated savings. You can continue the process as needed and step through the list ten parts at a time.
The process I describe is a good way to reduce the cost of tariffs. But to make a dent in the universe, there’s a much better way. It’s called Design For Assembly, or DFA, which is all about product simplification through part elimination. 35% reductions in the number of parts are typical. With DFA, high-tariff parts aren’t changed, they’re eliminated. But where classic DFA prioritizes eliminating the highest-cost parts, tariff-based DFA prioritizes eliminating parts with the highest tariff costs. The calculations to prioritize DFA-based tariff reduction are similar to those for DFM, but the savings are far more severe – the entire tariff and the part cost are saved. The DFA savings are
(part cost x volume x tariff percentage) + (part cost x volume)
Run the calculation for the parts in your supply chain and sort the results from largest to smallest. Take the list of the top ten to the design community and show them how much they can save if they eliminate the parts. Tell them they’ll be the Heros of the Company if they pull it off. Tell them you help them get the tools and training they’ll need. Repeat for the second group of the ten most important parts (11-20).
DFM and DFA are wildly profitable and with the added savings of tariffs, the savings are beyond wild. If there was ever a time to do DFM and DFA, it’s is now.
Image credit — Derell Licht
Posted in Cost Savings, DFA, DFMA, Fundementals, How To, Lean, Manufacturing Competitiveness, New Normal, Seven Wastes |
Tags: Design for Assembly, DFA, DFMA Culture, Engineering Capability, Product Design |
No Comments »
Resurrecting Manufacturing Through Product Simplification
October 2nd, 2024
Product simplification can radically improve profits and radically improve product robustness. Here’s a graph of profit per square foot ($/ft^2) which improved by a factor of seven and warranty cost per unit ($/unit), a measure of product robustness), which improved by a factor of four. The improvements are measured against the baseline data of the legacy product which was replaced by the simplified product. Design for Assembly (DFA) was used to simplify the product and Robust Design methods were used to reduce warranty cost per unit.
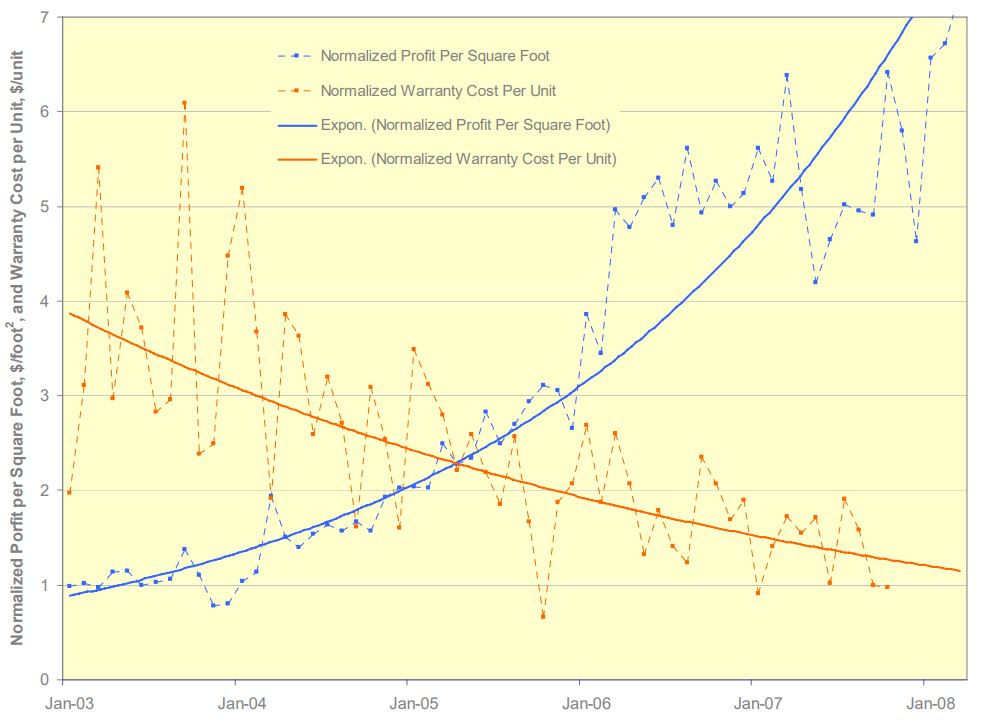
I will go on record that everyone will notice when profit per square foot increases by a factor of seven.
And I will also go on record that no one will believe you when you predict product simplification will radically improve profit per square foot.
And I will go on record that when warranty cost per unit is radically reduced, customers will notice. Simply put, the product doesn’t break and your customers love it.
But here’s the rub. The graph shows data over five years, which is a long time. And if the product development takes two years, that makes seven long years. And in today’s world, seven years is at least four too many. But take another look at the graph. Profit per square foot doubled in the first two years after launch. Two years isn’t too long to double profit per square foot. I don’t know of a faster way, More strongly, I don’t know of another way to get it done, regardless of the timeline.
I think your company would love to double the profit per square foot of its assembly area. And I’ve shown you the data that proves it’s possible. So, what’s in the way of giving it a try?
For the details about the work, here’s a link – Systematic DFMA Deployment, It Could Resurrect US Manufacturing.
Posted in Assembly Time Reduction, Bottom Line Growth, Cost Savings, Design Engineers, DFA, DFMA, Downstream Savings, Floor Space, Fundementals, How To, Lean, Manufacturing Competitiveness, Part Count Reduction, Product Development, Product Robustness, Robust Economy, Seven Wastes, Top Line Growth |
No Comments »
 Mike Shipulski